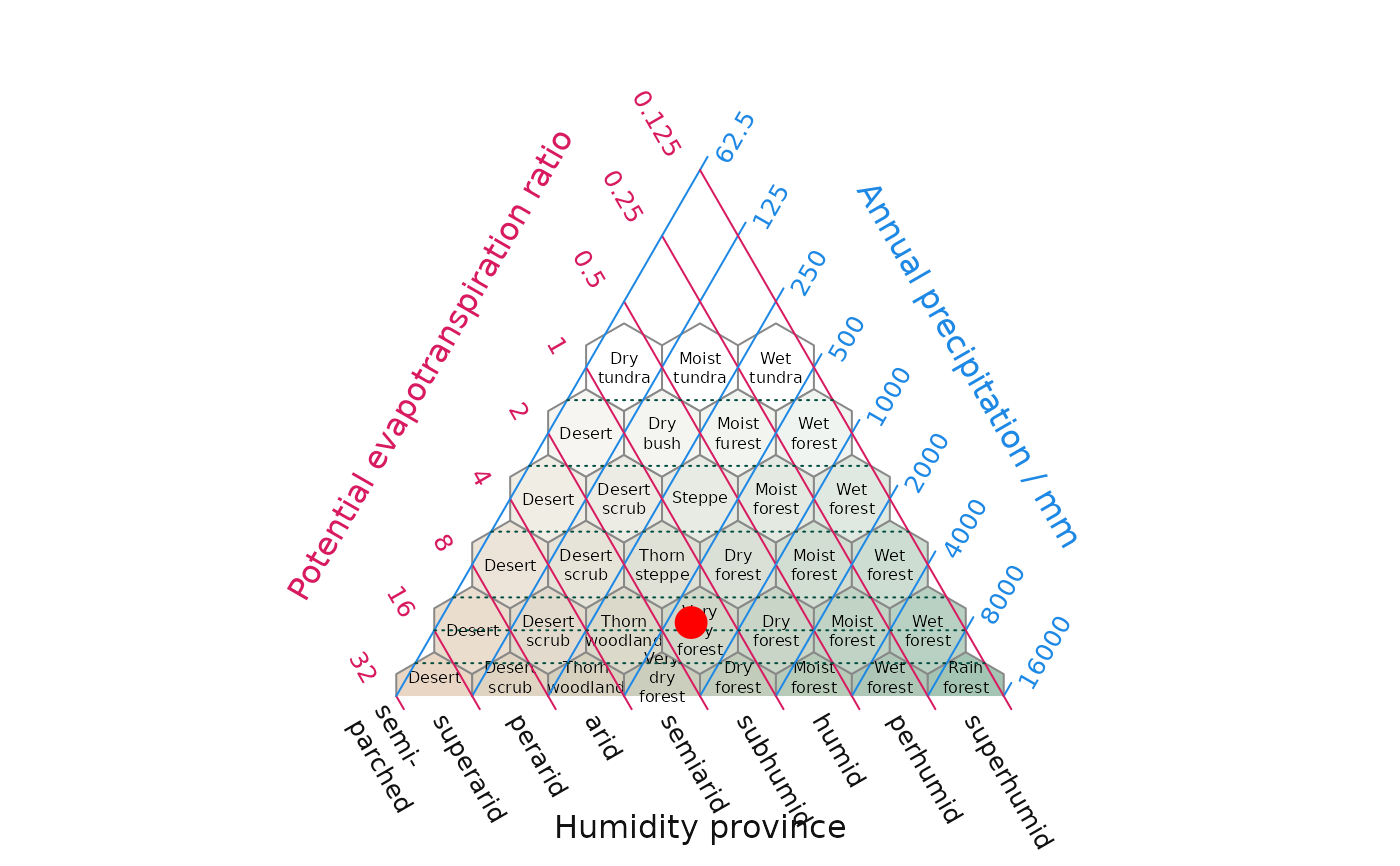
Creates a graph using the climate and elevation data which has
been extracted for a given location. It accepts the data formatted
from the ce_extract function.
plot_h(data, geo_id, col = "red", pch = 19, ...)Arguments
- data
List. Containing climate, elevation and latitude data sets. Structured by
ce_extract().- geo_id
Character. Corresponding to a specific feature contained in the
"location"argument (specifically in the"location_g"column).- col, pch, ...
Arguments to control point styling in
HoldridgePoints().
Value
plot_h() is principally called for its side-effects: it creates a
Holdridge simplex plot using the base R graphics functions, via the
Ternary package. It invisibly returns the results of a call to
bioclimate(), which reports the Holdridge data associated with each point.
References
Holdridge (1947), Determination of world plant formations from simple climatic data. Science, 105:367–368. doi:10.1126/science.105.2727.367Holdridge (1967), Life zone ecology. Tropical Science Center, San José.Smith, M.R (2017). Ternary: An R Package for Creating Ternary Plots. Comprehensive R Archive Network. doi:10.5281/zenodo.1068996
See also
Download climate data: ce_download()
Examples
# Step 1. Import the Italian Biome polygon data
# Step 2. Run the download function
# Step 3. Run the extract function
#* See ce_download & ce_extract documentation

# Steps 1, 2 & 3 can be skipped by loading the extracted data (it_data)
data("it_data", package = "climenv")

# Step 4. Visualise the climatic envelope using a Holdridge diagram

plot_h(data = it_data, geo_id = "MED")